segunda-feira, 25 de dezembro de 2023

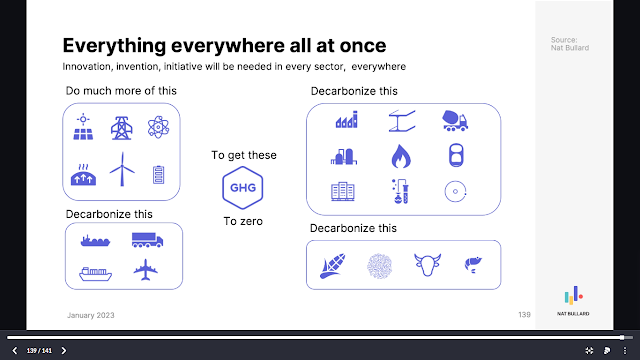
Decarbonization: The long view, trends and transience, net zero

 Some really interesting presentations by Nat Bullard on environment, energy and climate challenges.

(https://www.nathanielbullard.com/presentations)

Here are some examples of his presentation on:

"Decarbonization: The long view, trends and transience, net zero"


quarta-feira, 29 de novembro de 2023

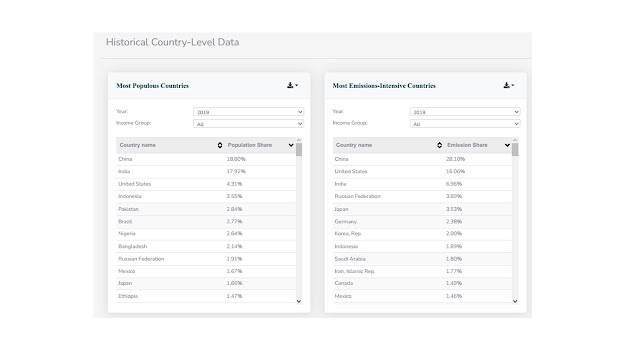
Climate - Emissions - (In-)Equality

 Oxfam recently published a report on climate equality. Climate change seems to be a serious socio-economic problem. But will the winners pay the bill?


Most of the report data is based on the data collections of the Stockholm Environment Institute and the Emissions Inequality Calculator.


Emission data on a world wide level is provided by climatewatch.org


terça-feira, 31 de outubro de 2023

Charts und Infographs


Spaghetti-Charts sind wirklich nur schwer zu durchschauen


Es könnte auch heißen: Mehr als die Hälfte aller Erhaltenden sind Migranten. 
Die große Herausforderung dabei ist es, Frauen über 30 Jahre in Lohn und Brot zu bringen.


Das ändert aber nichts an der Tatsache, daß die Grafik u.a. als Strukturgrafik dargestellt werden sollte und die Labels direkt und differenzierter in der Grafik angebracht werden könnten.


Aber: Wenn die PV-Anlage auf dem Dach ausreichend speicherbare Energie produziert kommt es auf die Dämmung auch nicht mehr so an....


sábado, 30 de setembro de 2023

Challenges and Goals


increase usage of renewables


avoid increase of sea water temperature


avoid destruction of coral reefs 

minimize impacts of AI advance


and the long way to sustainable development


quinta-feira, 31 de agosto de 2023

Tipping points

 we should massively invest in the reduction of GHG emissions in order to avoid those tipping points. Or is it already too late?


segunda-feira, 10 de julho de 2023

Grafiken aus dem Ostalbkreis

 ... es ginge auch einprägsamer und lesbarer.


und was gehört nun wohin? Eine Balkendarstellung wie unten wäre sehr viel aufschlußreicher gewesen


drei unterschiedliche Maßeinheiten (Temp, Niederschlag, Tage), aber dieselbe Darstellungsform...