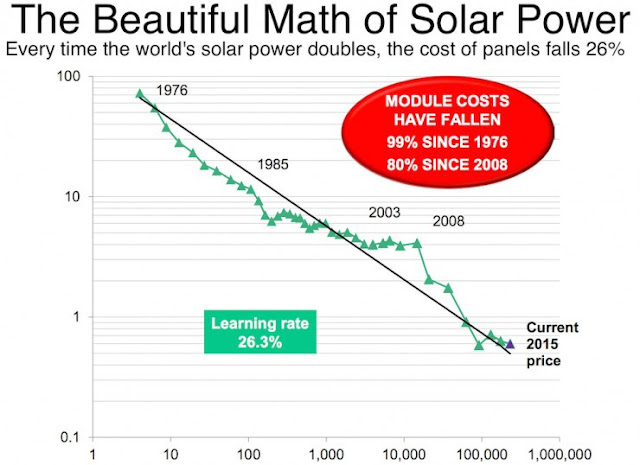
About two
months ago at www.storytellingwithdata.com there was a contest about annotated
line charts and almost 100
contributions were accepted.
As we can see there wasn’t that much creativity
involved.
New
approaches like multicharts with/and “timelines” are very rare.
 |
https://www.bloomberg.com/news/articles/2016-06-13/we-ve-almost-reached-peak-fossil-fuels-for-electricity


Nenhum comentário:
Postar um comentário