Mostrando postagens com marcador business charts. Mostrar todas as postagens

terça-feira, 25 de agosto de 2020

Charts and Tables in Annual Reports II

 In the last edition we showed some examples of charts and tables in annual reports. As can be seen, the charts used by the companies don't facilitate the understanding of information and underlying text. It seems that annual reports are considered more as a medium for PR effects and for "book readers" than for fast and detailed information means.

Our new examples show that in other segments like communication and media this behavior prevails.


Annual Report 2019  NZZ Mediagruppe


Charts


Tables


segunda-feira, 2 de abril de 2018

IBCS by SAP


As normas do IBCS agora também estão representadas no num front-end de BI da SAP – o SAPAnalyticsCloud. O expert Ingo Hilgefort mostra numa série de cinco artigos como os “Top 10 IBCS Standardization Elements” podem ser entendidos e como se encaixam dentro do SAPAnalyticsCloud.


sábado, 24 de fevereiro de 2018

Scaling – cut the axis...


Scaling is a very important item of the IBCS rules. When it comes to present extreme values for example very high income in one region and very low in other regions the normal way in a column chart was to cut the column in the middle applying a symbol like that //  


Not necessarily the best solution as we lose the magnitude relation between the charts.

By introducing a scaling area as shown in the next chart we maintain the relations and the reader still can imagine the proportions.


The next chart shows a very “tricky” way to solve the problem. Instead of cutting the column just cut the x-axes. As we can see by applying this we maintain the same proportions and everything fits in the chart.


segunda-feira, 19 de fevereiro de 2018

About line charts


About two months ago at www.storytellingwithdata.com there was a contest about annotated line charts and almost 100 contributions were accepted. 

 http://www.storytellingwithdata.com/blog/2018/1/22/88-annotated-line-graphs

As we can see there wasn’t that much creativity involved.

New approaches like multicharts with/and “timelines” are very rare.   


https://www.bloomberg.com/news/articles/2016-06-13/we-ve-almost-reached-peak-fossil-fuels-for-electricity


segunda-feira, 22 de janeiro de 2018

And here are the good news: IBCS goes mainstream

The first good news is that SAP Analytics Cloud is now IBCS/Hichert certified.


For those interested in applying visualization standards in their reports SAP offers now within their Analytics Cloud IBCS compliant charts.


It is no longer necessary to use third party tools within your SAP environment in order to produce highly sophisticated reports and dashboards.
For more information see the article of Blaž Zabukovec (https://www.linkedin.com/pulse/sap-analytics-cloud-now-ibcshichert-certified-success-blaž-zabukovec/) the official SAP announcement
  
 ZebraBI-PBI


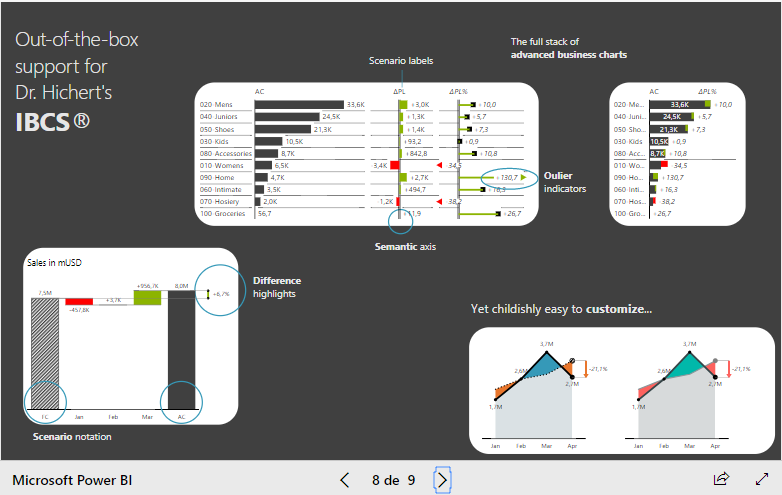
The second good news comes from ZebraBI which now offers a visuals add-on for Microsoft PowerBI. The fast growing PowerBI community can now use sophisticated IBCS-charts for reporting and dashboard design. As can be seen on a recently held Webinar (https://zebrabi.com/power-bi-webinar/#av_section_2) ZebraBI custom visuals do a great job in accelerated dashboard design.
For more information see https://zebrabi.com/pbi/


quarta-feira, 4 de outubro de 2017

A New Way to Visualize an Income Statement

O Andy Kriebel no seu blog VizWiz-Data Viz Done Right (www.vizwiz.com) apresenta de forma abundante e inovador um montão de casos de visualização de dados.
Um dos recentes casos trata de visualização de dados financeiros através do exemplo da demonstração de lucros e perdas (http://www.vizwiz.com/2017/07/income-statement.html)

Partindo de uma apresentação típica combinando gráfico e tabela ele mostra em seguida uma nova forma através de um dashboard.


Dentro do dashboard ele introduz alguns novos elementos de visualização como o bar chart em forma de bullet chart e sparklines para apresentar os desvios mensais com o orçado.
Assim ele consegue juntar dados estruturados (itens do P&L) com dados de séries de tempo.
Em relação à apresentação anterior é muito mais fácil de captar a situação financeira da entidade.
Porém fica um pouco difícil para o leitor de identificar a grandeza dos valores e o tamanho dos desvios entre o ano anterior e o atual.


Uma pequena reorganização do quadro seguindo a metodologia IBCS resulta em uma ainda melhor legibilidade dos valores. Organizando os itens de cima pra baixo na sequencia do esquema de calculo e escalonando os valores obtemos uma visão real dos valores absolutos e seus desvios nos determinados cenários. No lado direito podemos colocar as séries de tempo dos desvios em relação ao budget e até se for preciso fornecer os valores absolutos mensais.  


quinta-feira, 18 de maio de 2017

terça-feira, 28 de março de 2017

Charts of the Month


On LinkedIn* I saw this article from “24slides” (24slides.com) about “The (Real) Ultimate PowerPoint slides to save hours on your next pitch or business presentation.”
The offer is a nice set of presentation templates for different purposes, but unfortunately nothing useful for the serious data visualizer. But if you are one of the thousands of “entertainers” (as the “likes” show), the usage of such type of templates is a must for the next presentation of your business data and reports: Show me the forms and colors, but hide the numbers....

*https://www.linkedin.com/pulse/real-ultimate-powerpoint-slides-save-hours-your-next-pitch-jeffery