segunda-feira, 28 de dezembro de 2020

More Details

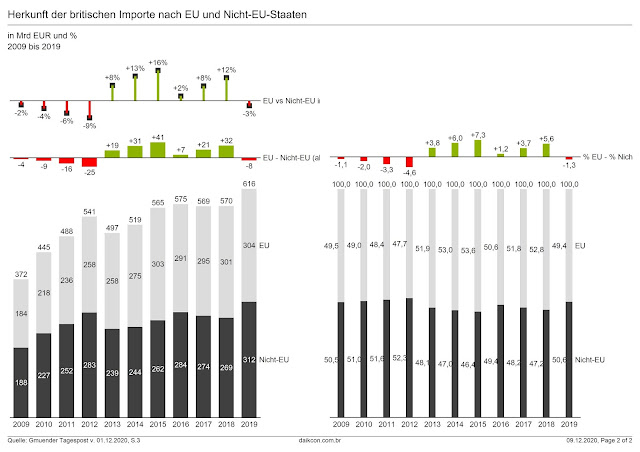
An Heiligabend 2020 haben sich die beiden Streitparteien Grossbritannien und EU doch noch auf einen geregelten Brexit einigen können. 

Aus der unten dargestellten Grafik lässt sich auch zumindest im Ansatz erkennen, was denn für beide Parteien in bezug auf ihre Handelsbeziehungen auf dem Spiel stand.  


Unter dem Gesichtspunkt einer gelungenen Datenvisualisierung hätte diese Darstellung jedoch durchaus etwas detaillierter sein können, um einen schnelleren und prägnanteren Überblick über die Sachlage zu bekommen. Wie die nachfolgenden Abbildungen zeigen, können Prozentanteile und Abweichungen sehr hilfreiche Darstellungsmittel sein.



domingo, 29 de novembro de 2020

Chart of the Month

 Die nachfolgende Grafik ist zwar nicht IBCS-kompatibel, aber dennoch sehr kreativ....


Quelle: CDU:Männlich, ländlich, unsicher Von Mariam LauDIE ZEIT Nr. 49/2020, 26. November 2020

Interessant wäre auch, dies noch für die restlichen im Bundestag vertretenen Fraktionen zu erstellen.


https://www.bundestag.de/parlament/plenum/sitzverteilung_19wp


terça-feira, 27 de outubro de 2020

É uma pena....

Já em junho este ano foi publicada na sua 31ª edição a mais nova Pesquisa Anual do Uso de TI da FGV/EAESP sob coordenação do Prof. Fernando S. Meirelles.

Trata-se de uma peça muito importante nas pesquisas sobre o uso de TI no Brasil. Pois através de sua longa existência poe muita luz na evolução do mercado de TI nas empresas brasileiras e ajudando pesquisadores e decision makers em se orientar melhor.

Porém, como profissional na area de visualização de dados me pergunto com cada nova edição, de como é possível pôr tão pouco enfase na questão da apresentação dos dados. Não conheço os motivos de continuar com os mesmos tipos de gráficos e layouts, mas talvez há de repente como explicação algumas barreiras da própria tecnologia de informação tais como templates antigos em Excel com as quais ninguem quer mexer ou fazer alterações. 

Tenho a impressão que o foco desta pesquisa concentra-se mais no levantamento, processamento e interpretação dos dados do que na sua visualização, da legibilidade e do rápido entendimento dos fatos apresentados. Talvez os leitores da pesquisa e o enorme número de veiculos de publicação atingidos tenham-se tanto acostumados nos últimos 31 anos ao estilo de visualização se no caso de uma modernização e aplicação de metodos de visualização mais atuais deixaria este público muito assustado. Mesmo assim sugere-se “uma pequena revolução” em analisar o uso dos conceitos de visualização de dados de um Stephen Few (http://perceptualedge.com/), Nicole Nussbaumer (http://www.storytellingwithdata.com/) ou da Associação dos International Business Communication Standards (IBCS) (https://www.ibcs.com/) para as próximas edições.


Links:


segunda-feira, 28 de setembro de 2020

Covid-19 data visualization II

 Some months ago I showed some examples of data visualization of Covid-19. As with the ongoing pandemic there rose some types of visualizations for better understanding. 

Spaghetti charts are always a bit confusing


A better way is to present the data by multiple charts


                but also considering the correct scale helps better understanding


Maps are good for a fast regional overview

Period presentation and visualization constraints


For comparison reasons multiple charts serve quite well


Keep it simple - ranked bar charts can do a good job 


logarithmic scale


                                                            or absolute cumulative

...and finally some IBCS compliant Covid-related charts by ZebraBI.com


terça-feira, 25 de agosto de 2020

Charts and Tables in Annual Reports II

 In the last edition we showed some examples of charts and tables in annual reports. As can be seen, the charts used by the companies don't facilitate the understanding of information and underlying text. It seems that annual reports are considered more as a medium for PR effects and for "book readers" than for fast and detailed information means.

Our new examples show that in other segments like communication and media this behavior prevails.


Annual Report 2019  NZZ Mediagruppe


Charts


Tables


terça-feira, 28 de julho de 2020

Charts and Tables in Annual Reports


These are the basic chart types used in the Daimler AG Annual Report from 2019.
It seems that the designers of the report didn't care much about readability and understanding of the numbers. Following the tendency of many words and few charts in annual reports they believe that investors prefer reading long texts than viewing smart understandable charts....


At the end of the report we find a ten-years data overview which could have been served as a nice base for smart and interesting time-series charts, comparisons and multiple charts...


quarta-feira, 3 de junho de 2020

IBCS-like Corona Charts

Neben den vielen nationalen und internationalen Dashboards zur Corona-Pandemie gibt es zwischenzeitlich auch einige Darstellungen, die den IBCS-Graphiken ziemlich ähnlich sind.
Doch bei genauerem Hinsehen gibt es hinsichtlich einer IBCS-Compliance doch noch kleine Differenzen....


                                                                                                                           Rems-Zeitung, 9./10.05.2020

Verbesserungswürdige Punkte in Zeitungsgrafik und wie sie realisiert werden könnten:
Nachbau nach IBCS jedoch ohne Absolutwerte


 Konzentration auf Aktuell- und Vorperiodenbetrachtung

Aktuell- und Vorperiodenbetrachtung mit Abweichungen mit zwei Fallzahlenkategorien

Aktuell- und Vorperiodenbetrachtung mit Abweichungen für Fallzahlenkategorie Verstorbene


Problem der Skalierung bei absoluten Werten wird sichtbar bei Betrachtung der Fallzahlen für
Neuinfizierte und Verstorbene

IBCS-konformer Nachbau obiger Zeitungsgrafik.