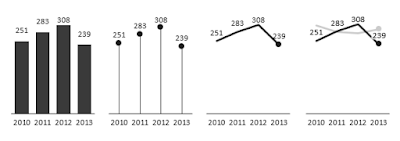
Em 18 páginas, Andrej Lapajne, o autor do folheto, explica através de 3 regras fundamentais como o gráfico certo possa ser escolhido.
Regra 1:
Display time horizontally, category items vertically
Regra 2:
Choose the right chart for your message
- STRUCTURE ANALYSIS (CATEGORY COMPARISON)
- TIME-SERIES (TREND) ANALYSIS
- PART-TO-WHOLE COMPARISON
- VARIANCE ANALYSIS
- CONTRIBUTION ANALYSIS
- CORRELATION ANALYSIS
- PORTFOLIO ANALYSIS
Regra 3:
Select the optimal chart shape for your data
- KPIs
- Scenarios
- Trends
O link para o download do whitepaper é: https://zebra.bi/blog/2015/08/13/how-to-choose-the-right-chart/


Nenhum comentário:
Postar um comentário