In her most recent publication Die Zeit (22.03.2024) published a dossier about the composition of the AfD supporters. Regarding the visual representation of the data they could have done better as we can see on the following images. Especially the chart on the gender composition is very artistic - much area, little information.


As in the past years the ABSOLAR continues to produce their charts with some limited methodology on data visualisation. This becomes obvious when we look at the mixture of pie charts and bar charts. The chart "Matriz Eletrica Brasileira" is of the same type - structural single year chart - but presented in a different way, as for example "Geracao Distribuida - Ranking Estadual" which comes as a bar chart and can be read much easier. Simplifying, unifying and structuring the charts could be more helpful for the reader.
.png)
.png)
.png)
.png)
.png)
.png)
.png)
.png)
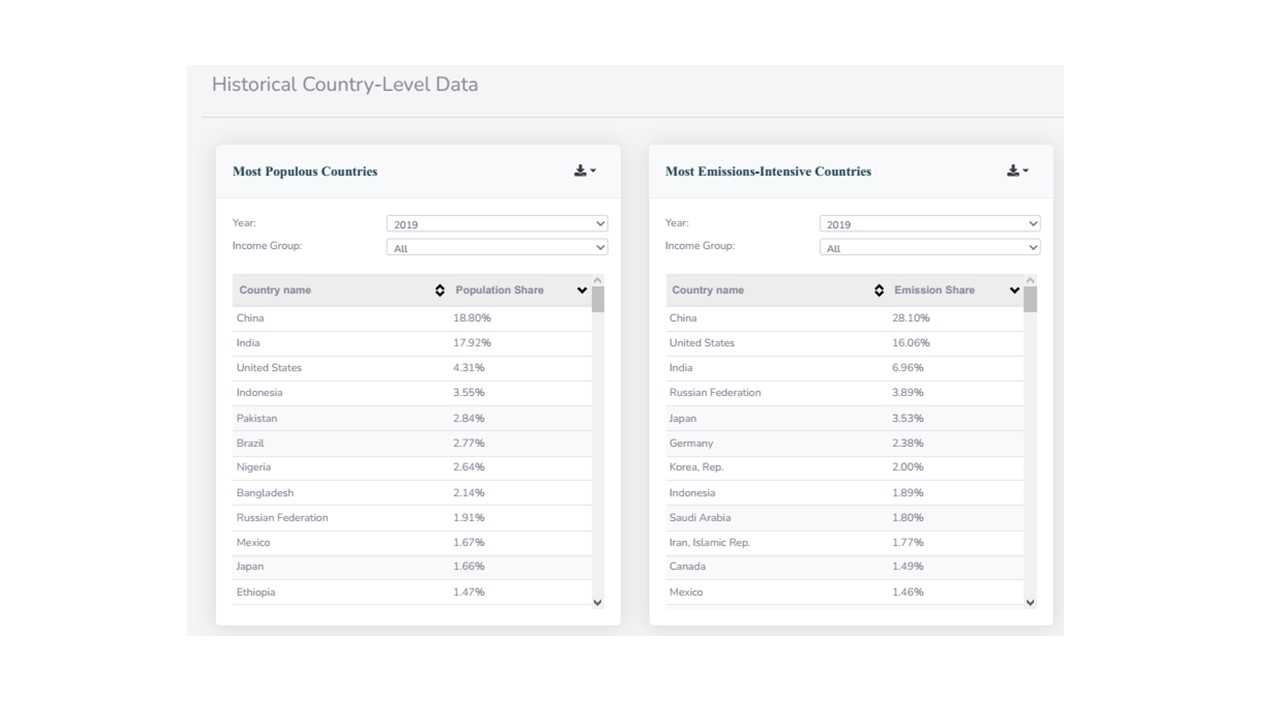
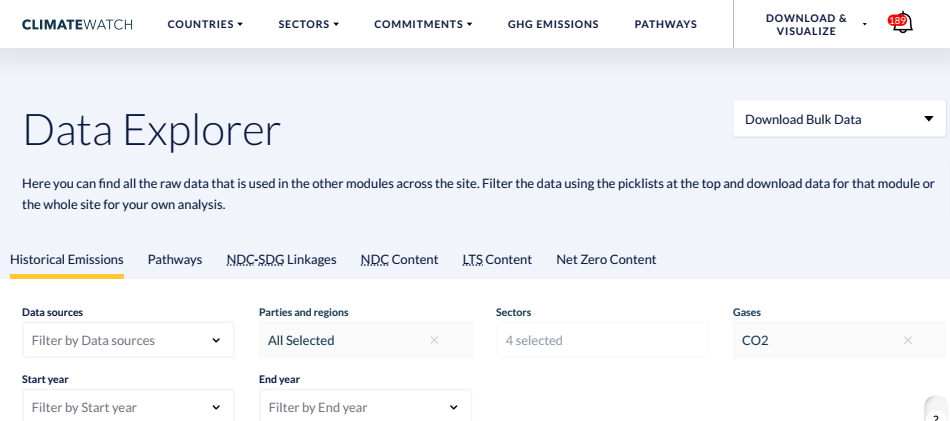
Different views of solar power production. Standard modules of browser presentation. Background color and scaling are in my opinion main deficits of presentation.


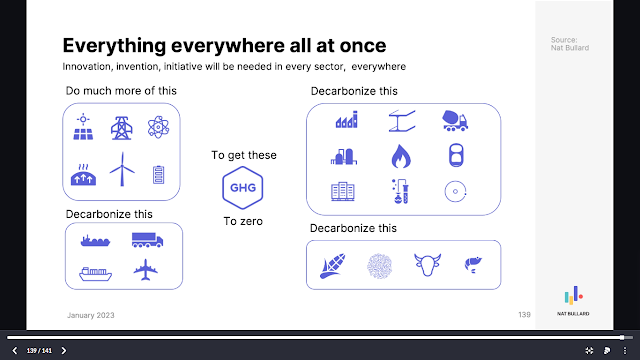
Some really interesting presentations by Nat Bullard on environment, energy and climate challenges.
(https://www.nathanielbullard.com/presentations)
Here are some examples of his presentation on:
"Decarbonization: The long view, trends and transience, net zero"


Oxfam recently published a report on climate equality. Climate change seems to be a serious socio-economic problem. But will the winners pay the bill?